Thursday, December 16, 2010

What we learned from the Zimpeto couve crop


This is the final post on the Zimpeto couve crop. So what did we learn?

It is possible, with the measurement techniques we had available, to grow a big couve crop with very little water, and in our case, no added nutrients.

We could do this by watching the watermark sensors to check the soil did not get too dry, and at the same time ensuring that the 500 mm detectors were only activated occasionally, to check that the soil did not get too wet.

Our irrigation strategy was very influenced by the nitrate readings. The very high readings around day 13 meant that we needed to be careful not to leach the nitrate out of the profile.

For example, we measured above 500 mg nitrate/L at 300 mm depth at the start of the experiment. At a soil water content of 25%, 500 mg nitrate/L adds up to around 85 kg N per ha in the top 300 mm of soil. We add another 10 kg in the irrigation water. This would be a large proportion of the total nitrogen fertiliser the crop requires.

How well could we have done if we just had the detectors and not the nitrate, conductivity and watermark sensors?

We can draw some lessons from this experience which suit this soil type and irrigation system as follows:
When we do not activate the detectors at 300 mm depth, the plants might be getting just enough water, or more likely not quite enough. When we activate the 500 mm detectors, the soil is very wet.

We could come up with the following guidelines:

1) When the plants are small, irrigate frequently but do NOT activate a 300 mm detector. This will ensure the nutrients are not leached.

2) As the plants start to grow quickly, activate the 300 mm detector once or twice per week

3) When the crop is at a yield-sensitive growth stage (for vegetables this is usually flowering time, or ‘hearting’ time for leafy crops) activate the 500 mm detectors a couple of times.
There is one remaining lesson. We must minimise the leaching of nutrients, but we must also manage the salt. By the end of the season the wet side had an extra 624 kg Salt per ha in the roozone. The dry side had more (660 kg of salt / ha), applied in the irrigation water.
A few larer irrigation events towards the end of the season, when the soil nutirent content tends to be low, will ensure salt levels do not build up too much in this soil. By deep I mean activating the 500 mm detectors. The detectors placed at 700 mm were too deep to be useful.

Salt and nitrate leaching?


Here we are using a mini disk permeameter to get some idea of how fast the water moves into the soil, and how wide the wetting patterns become. This all helps us to manage salt and nutrients.

We pumped water from the aquifer at an electrical conductivity of 0.8 dS/m. This equates roughly to 0.5 g of salt for every litre of water applied. So when we apply 159 mm of irrigation water we also add 865 kg of salt per ha. We did not measure which salts were in the water, but most of it is likely to sodium chloride. Plants don’t like sodium chloride. We can let it build up a bit in the soil, but eventually we have to apply extra water – more than the plants requirements, to leach the salt out.

The groundwater also contained 30 mg/L of nitrate. So when we are irrigating we are also applying some fertiliser.

On the 'wet side' we applied 159 mm of water, which has 865 kg of salt dissolved in it and this included 11 kg of nitrogen (in the nitrate form).

On the 'dry side' we applied 134 mm of water, which has 686 kg of salt dissolved in it and this included 9 kg of nitrogen (in the nitrate form).

That takes care of the input side of the equation. By collecting water from the wheelie bins - the water that the couve did not use - we can complete the output side of the picture (on a per hectare basis).

On the wet side we collected the equivalent of 18.6 mm of drainage water which had 241 kg of salt dissolved in it which included 11 kg of nitrogen (in the nitrate form).

On the dry side we collected the equivalent of 2.7 mm of drainage water which had 26 kg of salt dissolved in it which included 0.1 kg of nitrogen (in the nitrate form).


What did we catch in the bins?


One of the buried wheelie bins is just visible in the left of the picture. Up to day 40, the 300 mm depth detectors collected water 3 times. Then on day 41, after a few larger irrigation events, the 500 mm detectors collected their first samples. The detectors at 700 mm did not collect water, and there was no water in the bins.

A very large irrigation was applied on day 66 (13 hours or 8.45 littres per dripper or 28 mm averaged over the whole area). This time the 300 and 500 mm detectors collected, and water also started to collect in the bins. We measured drainage of 2.7 mm from the drier side and 18.6 mm from the wetter side.

We did NOT collect ANY water in the detectors at 700 mm depth.

Water must have gone past this depth because we measured water in the 900 mm deep wheelie bins. However none of this infiltrating water could be collected in a FullStop funnel at 700 mm depth. This tells us something about the limitation of the technique. They do not work when placed too deep.

A New Trick


The sandy soil was easy to dig and had no structure at all, so we could try a new trick. We went to a hardware store and bought a couple of the largest “Wheelie” bins we could find. These were dug into the soil and gravel placed in the base. Now we needed a means of showing how much water collected at the bottom of the bins. We used the 'base piece' and 'float housing' from the wetting front detectors to make a ‘riser’ to the surface. The filter screen in the base piece allowed the water into the riser. The 4 mm off-take on the base piece and tubing was used to suck water out. Then we placed a thin round stick into the float housing (where the floats normally go) so we could measure the depth of water inside – much the same as we use a ‘dipstick’ to measure the amount of oil in the car engine.

The bins were refilled with soil in the order it was removed from the hole and the drip tape went back over the top. Two couve plants were then planted in each bin. Now any water or nutrient going past the couve roots would collect at the bottom of the bin (900 mm) and could be measured accurately.

You can see the setup going in on youtube at

http://www.youtube.com/watch?v=Cyj6BzdUllI

Monday, December 13, 2010

How good were we really?


This was a good crop, grown with very little water. The first detector samples at 30 cm depth showed that we had lots of nitrate in the soil, left over from the chicken manure applied to previous crops. So we managed with just the nutrients already in this sandy soil. But how good were we really?

For those who follow this blog you will know that I think across five strands of enquiry to answer this question:

1. LOCAL KNOWLEDGE: what do the people I’m working with already know? What do they do and why, and how did they arrive at these practices?
2. THERMODYNAMICS: Measure the water going on - by flow meter, irrigation run time, collecting water in cups (or whatever) and compare with the theoretical amount that can be evaporated - from a weather station, a model, an evaporation pan (or whatever). It does not matter if the method is rough – as long as it is consistent.
3. SOIL WATER STATUS: I go for the simplest measurement protocol and, once I have some local experience, target only a few depths that can give me most of what I need to know (usually Watermark sensors at two depths)
4. WETTING DEPTH: Wetting front detectors that give a visual indication to the irrigator of how deep the irrigation water has penetrated into the root zone
5. SOIL SOLUTION: Measure the electrical conductivity and nitrate concentration from the water samples collected from the wetting front detectors

The reason for five strands of enquiry is that they are independent, but complementary lines of evidence. Frequently, if you look at one strand alone, you think you are doing OK (say soil water status: strand 3). Then you look at nitrate leaching or salt accumulation (strand 5), and it gives a rather different picture. So then you need additional information, like the ratio between water applied and potential evapotranspiration so you can troubleshoot (strand 2).

Wetting front detectors are useful at showing how deep the water is going, and the salt and nutrients that are being carried with the water. But they are not perfect. For example, infiltrating water is captured by the funnel, but when the soil in the funnel is saturated, and the soil outside the funnel is slightly drier, then water can be ‘wicked’ out of the funnel as fast as it arrives. This happens especially in fine sandy soils with no structure, and also when the wetting front detectors are placed quite deep. The water is passing the detector quite slowly, and although some water is accumulating inside, it is wicked out again before the float can pop up.

This was a perfect site to test the ‘problem’ of deep detectors, and to see how much water and nutrient could go past.


Monday, November 29, 2010

The couve crop: Day 70


By day 70 all the couve had been harvested. We picked 27.7 tons per ha from the wetter side and 33.3 tons per ha from the drier side. When we add in the thinning harvest around day 40, the totals were 35.2 t/ha on the wetter side and 33.3 t/ha on the drier side. The crop looked good and tasted good, but we do not have any benchmark to compare it to. We could not find any other data from Mozambique.


It took a total of 159 mm to grow 35.2 t/ha of couve and 134 mm to grow 33.3 t/ha on the dry side. Moreover the last few large irrigations probably were not needed – I just wanted to get samples from the 30 and 50 cm deep detectors. For those familiar with crop water use, this is an incredibly small amount of water to grow a 70 day crop. There is no weather station or evaporation pan data available in Maputo, but we know that irrigation averaged just 2.3 mm/day (wet side) and 1.9 mm/day (dry side) during the warm to hot weather marking the end of the dry season. Of this irrigation water, some must have been lost to direct evaporation from the soil. And maybe some to drainage? (more later on this topic!)

The big irrigation at the end of the season wet the soil profile up again and allowed us to get some more nitrate samples from the detectors. The nitrate at 30 cm was 24 mg/L and at 50 cm was 37 mg/L – just a bit lower than the readings back around day 40.


The big irrigation also refilled the profile on the dry side. The nitrate reading at 30 cm was 51 mg/L and at 50 cm still a high value – 139 mg/L. Both the wet and the dry side started with high levels of nitrate. How much of this did the plant actually get, and how much leached below the roots? Amazingly, we pretty much know the answer to this question.
Coming soon!


Sunday, November 28, 2010

The couve crop: Day 65

Day 65 and the couve harvest is in full swing. The couve are now 60 cm apart (after the ‘thinning harvest’ around day 42) and they are touching within the rows, but not fully covering the inter-row space.

Around day 42 we did some larger irrigations just to get some wetting front detector samples for nitrate analysis (discussed on the last posting). Then we returned to miserly water supply – giving an average of just 0.9 mm per day on the dry side and 1.5 mm per day on the wet side. Have a look at the size of the plants again, and realise that the weather here is pretty warm – reaching 25-35 degrees C most days and no rain. Could it be possible that the soil remained moist with such a little water under such conditions??

The idea was to irrigate the wet side for two hours when the watermark sensor at 20 cm depth reached 10 kPa. This was achieved, but in the process the subsoil (40 cm) started to dry out slightly as well. There was never enough water to reach the detectors at 30 cm .


The dry side was irrigated when the tension at 30 cm reached 20 kPa. This meant there were fewer irrigation events, and the subsoil started to dry dramatically. So clearly the couve was using more than the average supply of 0.9 mm/day, and was mining the soil storage to do so.


Monday, November 8, 2010

The Couve crop: Day 42


By day 42 the couve had grown substantially. Every second plant was harvested around this time, to give the remaining plants the space to grow to full size. We harvested the equivalent of 8 t/ha from the wet side and 7.1 t/ha from the ‘dry’ side of the block from this 'thinning'.

Between day 15 and 35, irrigation was applied every second day for about 30 minutes. During the last week of this period three larger irrigations in the range of 2-4 hours were applied to try and push water down to the detectors buried at 30 and 50 cm. Over the 15-42 day period the ‘wet side’ received an average of 2.5 mm per day and the dry side 2.1 mm per day.

Irrigation on the wet side every second day for about 30 minutes up to day 35 resulted in the soil drying slightly at both depths (to around 20 kPa). Each of the three longer irrigation events after day 35 activated the detector at 30 cm depth, giving nitrate values of 79 (day 36), 33 (Day 38) and 46 mg/L (day 41). The third event activated the detector at 50 cm giving 42 mg nitrate/L. At the same time the watermark sensors recorded the soil suction returning to close to zero art both depths.
The soil suction also rose on the ‘dry side’ as the water use by the couve exceeded the 2.1 mm/day provided. Each of the three longer irrigation events between days 38 and 42 activated the detector at 30 cm depth giving values of 400, 235 and 192 mg nitrate/L. The third event activated the detector at 50 cm giving 164 mg nitrate/L.
These nitrate values were much higher than the ‘wet side’, showing how small differences in irrigation management can have a huge impact on nutrition.

The Couve story: Day 15


Bare rooted seedlings start off slowly, and by day 15 the crop was still small. We irrigated every day for about 30 minutes, to keep the soil immediately around the seedlings wet. The block was divided in half, with a ‘wet’ side and a ‘dry’ side. The idea was to make sure the wet side always had enough water, and then to push the dry side as far as we could. However, over first two weeks both sides got just about the same – the equivalent of 1.7 mm per day on the wet side and 1.6 mm per day on the dry side.

For a few weeks we are going to follow the graphs below. On the left axis we see the soil 'wetness' (suction in Kpa) at depths of 20 and 40 cm as logged by the watermark sensors. On the scale below we consider a reading less than 10 kPa to be wet; 10-20 kPa to be 'OK'; 20-40 kPa to be getting dry; and greater than 60 to be dry.
The pink and red diamonds show us when wetting front detectors captured samples at 20 and 40 cm depth. In this case we plot the data as the nitrate concetration of the water collected (on the right hand axis).

Tiny plants plus daily irrigation meant the soil stayed very moist on the ‘wet side’, but the irrigation events were not sufficiently long to activate the 30 cm detector. So on day 13 we did a longer irrigation (1.3 L per emitter) just so we could get a water sample at 30 cm. The nitrate level was 440 mg/L - a surprisingly high value (the pink diamond).

Chicken manure had been applied to the previous crop, but just a few watering can loads of ‘compost tea’ to the young couve seedlings. The irrigation and nutrient strategy was obvious from here. No more fertiliser or manure, and irrigation needed to be short and frequent so as not to leach the nutrients below the shallow root zone.


Although the ‘dry side’ of the block received almost as much water as the 'wet side', the 40 cm watermark sensor showed the soil as slightly drier (the blue line - around 10 kPa). But the really big difference was the nitrate reading on day 13: 866 mg/L! This sandy soil had loads of nutrients (the pink diamond) despite applying nothing to this crop.

The Couve Stroy: Day 1

We transplanted the couve just next to where the beetroot had been grown. The drip lines were spaced 1 m apart, with drip emitters 0.3 m apart giving about 0.65 L per hour.

We used bare rooted seedlings which we bought from a farmer over the road. Seedlings were transplanted right next to the emitters (3.3 plants per square m).

We watered the seedlings in with 'compost tea' but other than that applied no fertiliser. Here begins the experiment to see just how little water and nutrients we could get away with.


The Couve Story: Before planting

Before planting, we installed the usual gear. Wetting front detectors went in at 30, 50 and 70 cm depths directly below drip emitters. We had reason to believe from the previous beetroot crop that a lot of water might be going past the root zone on this sandy soil, hence the deep placement of detectors.


Extra detectors were installed and converted to electronic, so we could log the time water arrived at 30 and 50 cm depths and the electrical conductivity of the draining water. In the picture above I am placing a home made electrode down into the wetting front detector.

Watermark sensors were installed at 20 and 40 cm depths and these, together with the EC sensors, were connected up to a logger situated in the belly of the scarecrow on the right.

Now we were ready to take all the usual measurements. We knew the amount of water going on (scroll back to the Beetroot experiment to see the crude flow meter). We could measure how depth the water penetrated and take water samples for nitrate and salt measurement from the wetting front detector, and we logged to soil water suction.


The Couve Story

Here are some of the children and their carers at the Zimpeto Centre, Mozambique. Each day, 150 kg of rice is cooked up in the Centre’s kitchen to feed them. Meat is too expensive except for very special occasions, but the children do get beans or dried fish several times a week. The rice is served up with a kind of soupy vegetable stew, usually comprising onions and green leafy vegetable that looks to me like kale (a kind of loose leaved cabbage). The locals call it couve.


Our task was to grow the couve, but there are two problems. First, Zimpeto is like a giant sand pit, as you can see from the picture, and that makes growing vegetables a challenge. Second there is no piped water in this part of Maputo. The Centre pumps all the water for the 400 inhabitants from groundwater beneath our feet, and from time to time we run out of drinking and washing water. Throwing water into the sandpit to grow couve made our maintenance man very nervous.
But this was the perfect setting to see how good we could be in managing the little water we have.

Sunday, September 26, 2010

Beetroot 2: What about the nutrients?

For the first couple of weeks the beetroot was irrigated as per usual practice. We regularly collected water samples in the wetting front detectors. The nitrate readings were astoundingly high, much higher than I ever see in my garden (see the corn plots in earlier posts). No nutrients had been applied to the beetroot. However a large amount of chicken manure had been incorporated into the soil several months before, since this soil is little more than beach sand.

Activating a detector at 30 cm depth was clearly not necessary for little beetroot plants. So we slowly cut back the water as can be seen on graph below (the cumulative irrigation line starts to rise more slowly). Although the water use was not excessive, the precipitous drop in nitrate through August was almost certainly due to leaching.

For much of the second part of the season we irrigated in such as way so as NOT to activate the detector. This would help bring the leaching under control, but we were now not sure if we were giving too little water.

This was going to be difficult soil to manage. Next we set up a much more detailed trial to answer these questions and more.

Beetroot 2: How much water does it need?

A second beetroot crop was transplanted the same week as the first one was harvested. This gave the opportunity to evaluate the irrigation in more detail. We had a system to show how much water was going on (the bottle). Now we needed an estimate of how much water the beetroot could use.

Unfortunately we could not find any evaporation data for Maputo, so the usual crop factor x potential evaporation method was going to be difficult. Moreover the beetroot had been planted as one seedling on each dripper, because the wetting patterns were small on this sandy soil. With lines 1 m apart and dripper spaced at 30 cm, this gave just 3.3 plants per square metre. There was a lot of bare soil, making the choice of a crop factor difficult.

So we installed a wetting front detector 30 cm below the drip emitter. In fact wetting front detectors had been installed in the first beetroot crop and the boys had reported that the indicator floats were almost always in the up position. Now we could link the amount of water applied with the response of the detectors.


Beetroot 2: how much water goes on?

The beetroot were cooked up in a spicy sauce and served on top of rice for the 300 or so lunches that the kitchen serves up every day (meat is too expensive, so the children live largely on bread and rice topped with a vegetable-based sauce). It tasted good, but our question is how well was it grown? How much water and nutrients did it take to grow? Could we grow much more beetroot with the same inputs?

The irrigation system was fitted with a tap timer, and there were small taps at the head of each drip line. So each drip line could be individually turned on and off. Theoretically we should know how long each drip line was run for and hence the application of water to the beetroot. Then we could look up the potential evapotranspiration for Maputo, make adjustments for the size of the crop, and we should be able to answer the question above - at least as far as water goes.

In practice it’s not that easy. First, no one keeps good enough records of the on/off times of the taps. Second, the application rate of the drippers was not constant. Although rated at 1.0 L per emitter per hour, we were running the system at lower than recommended pressure, and the more lines open the more the pressure fell. Actual application rates varied between 0.5 and 0.7 L/h

We rigged up a simple flow meter as in the picture below, with graduation marked on the bottle. We checked the uniformity of 20 drippers down the line, and compared this to the dripper we collected from. The system was uniform. So that solved the first question – how much water went on to the crop.

Beetroot 1


Unlike the farms down the hill which are irrigated from shallow groundwater, we had to rely on water pumped from about 20 m beneath us. The water was pumped to plastic tanks on an 8 m high stand and then gravity fed into our drip irrigation system. The drip lines were spaced 1 m apart, with drippers 30 cm along the lines.


The boys were harvesting beetroot during my first week in Maputo. It was an impressive crop, especially given the light sandy soils.

The Children's Centre has limited water, and the aquifer from which we were pumping already had some nitrate contamination. So although the crop looked good, we had to find out how much water and nutrients it took to grow it. This becomes our next project.


Saturday, September 25, 2010

A food plot in Maputo

Last year I set up a food garden at the Zimpeto Children's centre together with some friends at Eduardo Mondlane University in Maputo, Mozambique. The Zimpeto Children's Centre feeds, houses and schools about 350 children every day. The purpose of the garden is to give some of the older children at the Centre training in food production, and to provide vegetables for the Centre's kitchen.


Before we look at the Zimpeto garden, we will take a short tour of the food plots just across the road from the Centre. Although it looks like a rural area, it is still within the city of Maputo, in a densely populated area. The vegetables are grown in small beds with raised edges and are watered by hand.


The natural watertable is quite near the surface. The farmers dig holes so they can access this water. They dip the watering cans into the small pools of groundwater. Several hectares of land are irrigated using watering cans, mostly by young kids. The method seems to work well, but is incredibly time consuming. Also the Zimpeto Children's Centre is situated further up the hill where the groundwater is far too deep to access in this way.


The final comparison


The two plots were planted 25 days apart, so the source of the irrigation water is not the only difference. For example:

1) the NaCl plot crop grew during cooler weather (ETo 371 vs 467 mm)
2) the NaCl plot required much less irrigation water and also received less rainfall

Here are some of the main observations:
1) Same water quality in terms of Electrical Conductivity (EC) and similar maximum EC (which is not very high).
2) Both plots had lots of nitrate
3) The washing machine water plots had lots more P and higher pH
4) The final yields were similar

Nitrate: kg in the soil

Up to now I have recorded the nitrate concentration in the water in the detectors (in mg/L or ppm). With a few assumptions, I can estimate the amount of nitrate in the soil in kg/ha, which is how we normally think of nutirent levels. Assuming the water content in the soil when the detector collects is 35%, and the collected sample is representative of the soil water as a whole, the mass of nitrate can be calculated.

The values in the graph are calculated over the top 50 cm of soil (I averaged the shallow and deep detectors), and are surprisingly high. It is probably a consequence of the relatively high organic matter levels. The decline in nitrate through the season is hopefully mostly plant, but there would be leaching losses as well.

pH

This is the pH of the water collected from the shallow detectors.

I was surprised to see how low the pH was - less the 5 in the NaCl plots! The plot irrigated with washing powder started a bit higher (5.7) and increased to 6.5. The washing machine water had a pH of 9.5 .

Phosphorus

This is the phosphorus level in the soil water solution collected in the shallower wetting front detectors (i.e. not a Bray or Collwell soil extraction).

See what a huge impact washing maching water has on soil P!!


Salt: The second sweetcorn plot


In both plots the irrigation water had an electrical conductivity of 1.27 dS/m. This equates to about 800 ppm salt. The second sweetcorn plot was irrigated with water made up to 800 ppm with common table salt (NaCl), whereas the first plot had 800 ppm salt from the washing machine water (top graph).
Once again the salt levels never rose very high. This was largely because such a small amount of irrigation was required (just 55 mm), and there was a substantial amount of rain.

Nitrate: The second sweetcorn plot

The wetting front detectors were installed deeper in the second plot - at 30 and 50 cm instead of 20 and 40 cm as in the washing machine plot.
The second corn crop (with NaCl added to the water) also had a lot of nitrate in the soil before any fertiliser was added, with over 700 ppm nitrate recorded by week 4 (above).
This time more nitrate was recorded in the shallow detector (which in this case was at 30 cm depth). In the washing powder plot, most of the nitrate was in the deeper 40 cm detector (top graph).
Such high levels of nitrate meant that no more additions of nutirents were reqired. Once again it was important to manage the irrigation so as not to leach the nitrate out of the root zone.

Water: The second sweetcorn plot


The soil water potential for the second plot stayed in the wet zone for most of the season (above). The early season rain and the cooler autumn weather towards the end of the season meant that there was no water stress.

This is in contrast to the crop grown with washing machine water which experienced soil water tensions up to 60 kPa just prior to the weekly irrigation (top graph).

Irrigation: The second sweetcorn plot


This time we will look at the whole season in one go rather than the week-by-week unfolding story. I will use the usual headings of IRRIGATION; WATER; NITRATE; SALT.
The new sweetcorn plot was irrigated with water made as salty as the washing machine water. But this time I used common table salt (NaCl) to increase the salinity of the water. Being planted later, the second crop experienced quite different growing conditions. The two plots can now be compared.
The graph above shows the rainfall and irrigation ratio (irrigation/ETo) for the second sweetcorn crop (NaCl). This plot was planted 25 days after the plot grown with washing machine waste water described in the previous posts (top graph).
The second plot received a lot of early rain and took a week longer to mature as it grew through late summer/autumn. Total ETo for the season was 371 mm, rainfall 246 mm and irrigation just 55 mm.


A Long Break...

It has been a long break between posts. My excuse is that I was waiting for laboratory results to get a bit more information on what was changing in the soil during the corn crop (particularly changes in Phosphorus and pH). Then I had to travel to South America, USA and Europe to run some workshops and I am now in Africa. So I've been out of the garden for over three months.

Nevertheless there is much to report.

1) If you want to get a full summary of the first sweetcorn crop you can download
"Science and the irrigator: a learning manifesto" from the link below
http://npsi.gov.au/products/npsi310

2) 25 days after sowing the sweetcorn crop, I planted a second plot of corn and irrigated with water of exactly the same salinity as the washing machine waste water. But this time I made the water 'salty' using common table salt instead of washing powder. I will post the whole of season results next.

3) Then I'll show how the soil pH and Phosphorus levels change when using salty water and washing machine water.

Wednesday, April 7, 2010

The Yield

The Government Department responsible for advising on corn growing in my region suggests the following:

Recommendation 1: use between 500 and 700 mm of irrigation

I applied 172 mm washing machine water
There was also 282 mm of rain during the crop (with 120 mm coming in just 2 days much of which ran off the surface). That makes a total (irrigation plus rain) of 454 mm.

Recommendation 2: Apply 200 kg N fertiliser (50 kg at planting, 120 kg at 3 weeks and 30 kg at 5 weeks).

I applied no fertiliser or manure at planting. I measured 500 ppm nitrate in the deeper wetting front detector one week after planting. Using calculations I will not give you here – that means I already had more than 200 kg of N in the top 60 cm of my soil. But I did apply 10 kg N/ha at both weeks 4 and 7. Total N fertiliser application 20 kg/ha.

Recommendation 3: Expect a yield of 12 to 22 t/ha of fresh corn (in husk)

My yield was 22 t/ha but some of the cobs were not properlly filled with kernels (the second ones on the plant), which dropped the marketable yield to 20 t/ha

My conclusion:
Good yield with not much water and very little fertiliser.

But wait till you see what the washing machine water did to the soil pH and the level of phosphorus!

Actually I’m monitoring the adjacent bed which was planted one month later. I’m using a pure sodium chloride solution – to the same electrical conductivity as the washing machine water - and getting very different results.

More soon….

Friday, March 26, 2010

The Harvest

For the last two weeks we have been eating the corn. By next week I'll be able to give you total yield and water use.
There are no other graphs this week because I did not irrigate.
More data is coming including the change in soil pH and phoshorus levels over the past 3 months

Monday, March 15, 2010

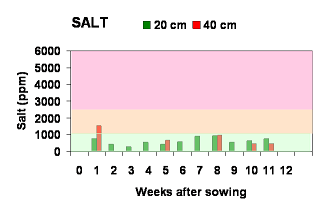
Week 11: Salt

By now I expected the salt to be in the red zone. I'm wrong

Week 11 Nitrate

Very little nitrate detected at 20 and 40 cm depths

Week 11: Water

The 60 mm of rain in week 11 has wet the top soil again.

This is the week where I ran out of time to look at the data. And this is also the time the logger decided to stop working. You will see next week that there will be several days of missing data.

There is a lesson here. I collect lots of data from lots of places and usually have too much information to make sense of it all. Add to this the inevitable hardware breakdowns and we have information overload plus information gaps = wasted opportunities.

The point is that the effort in monitoring (time and expense) must be matched by the amount I am learning. If I can't turn the information into better decisions and a deeper understanding of the system I'm managing then .....

Week 11: Irrigation

Another wet week. 60 mm over 3 days got a response from both detectors. No irrigation was required.

Week 11: The Crop

Close watchers of this blog will note that this post is almost a week late. The whole idea of a blog is to let the experiment unfold in real time, so we can see the data together and so that I can explain (justify) the decisions I make. Last week I got too distracted and ran out of time. As you will see later - there is a price to pay for this!

The crop is almost ready to be picked.

Friday, March 5, 2010

Week 10: Salt

Before the experiment started I produced the axes of the graphs with the green, orange and red shading. This was to give you some idea of what I expected to happen. I expected the salt to get up into the orange and maybe the red and then I would leach it out. But it did not happen that way. But stay tuned.....the story is not over yet.