Friday, March 26, 2010

The Harvest

For the last two weeks we have been eating the corn. By next week I'll be able to give you total yield and water use.
There are no other graphs this week because I did not irrigate.
More data is coming including the change in soil pH and phoshorus levels over the past 3 months

Monday, March 15, 2010

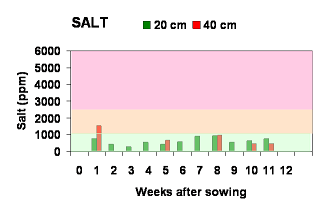
Week 11: Salt

By now I expected the salt to be in the red zone. I'm wrong

Week 11 Nitrate

Very little nitrate detected at 20 and 40 cm depths

Week 11: Water

The 60 mm of rain in week 11 has wet the top soil again.

This is the week where I ran out of time to look at the data. And this is also the time the logger decided to stop working. You will see next week that there will be several days of missing data.

There is a lesson here. I collect lots of data from lots of places and usually have too much information to make sense of it all. Add to this the inevitable hardware breakdowns and we have information overload plus information gaps = wasted opportunities.

The point is that the effort in monitoring (time and expense) must be matched by the amount I am learning. If I can't turn the information into better decisions and a deeper understanding of the system I'm managing then .....

Week 11: Irrigation

Another wet week. 60 mm over 3 days got a response from both detectors. No irrigation was required.

Week 11: The Crop

Close watchers of this blog will note that this post is almost a week late. The whole idea of a blog is to let the experiment unfold in real time, so we can see the data together and so that I can explain (justify) the decisions I make. Last week I got too distracted and ran out of time. As you will see later - there is a price to pay for this!

The crop is almost ready to be picked.

Friday, March 5, 2010

Week 10: Salt

Before the experiment started I produced the axes of the graphs with the green, orange and red shading. This was to give you some idea of what I expected to happen. I expected the salt to get up into the orange and maybe the red and then I would leach it out. But it did not happen that way. But stay tuned.....the story is not over yet.

Week 10: Nitrate

I collected water samples from both 20 and 40 cm detectors this week. The nitrate has gone. I'll never know how much was taken up by the crop and how much was leached in the rain. But I am confident I managed the system as well as I could to give the crop the best chance of getting the deep nitrate out of the soil. It is why I gave the small irrgations and let the topsoil dry out on weeks 6, 7 and 9.

Week 10: Water

The soil got very wet after all the rain in week 8. In week 9 I only irrigated till the 20 cm detector responded. We cannot see the week 9 irrigation (11 mm) on the water graph - the soil just keepos getting drier. That is why I did the big irrigation this week until the 40 cm detector responded. Now the top soil is fully wet again.

Week 10: Irrigation

This week I decided to keep irrigating until both the 20 cm and 40 cm detectors collected a sample. This required 34 mm, which was 1.17 times the potential evaporation for the week.

Week 10: The crop

Hopefully the kernels are filling inside the cob.